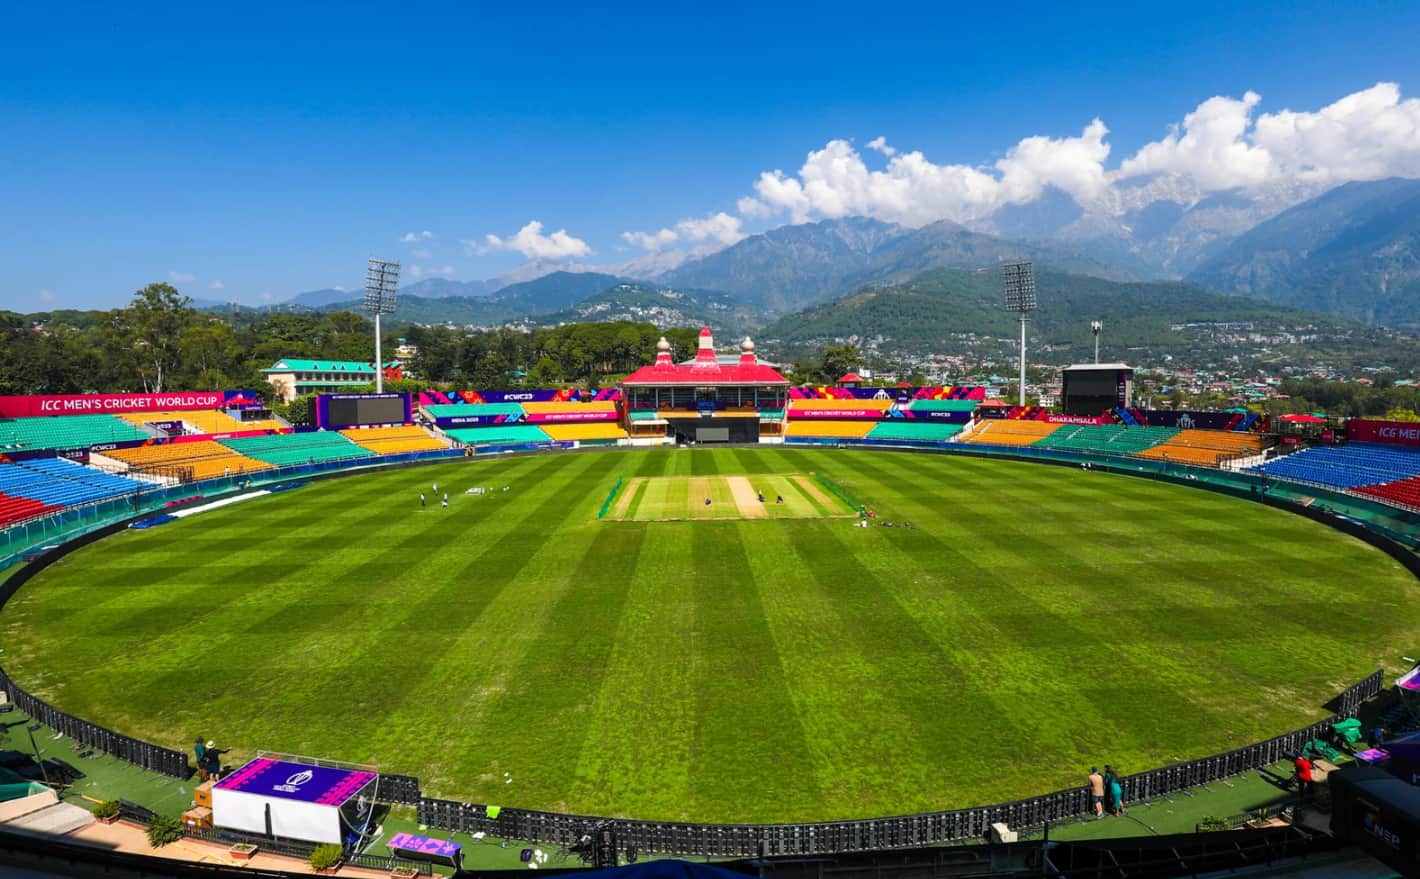
HPCA Stadium Dharamsala, opened in 2003 and started hosting international cricket in 2013.
The venue sits at 1,457 meters in Himachal Pradesh. Capacity is 21,200 spectators.
The stadium has hosted 2 Tests, 9 ODIs, and 10 T20Is. It also hosts IPL matches regularly.
The pitch offers bounce for fast bowlers and turn for spinners. Batting is generally easier under lights.
HPCA Stadium Dharamsala Records in Test, ODI, and T20I
This guide breaks down HPCA Stadium Dharamsala Records in Test, ODI, and T20I format by format.
Test Records (Ranked Top 5)
Here are the five most significant Test cricket records at Dharamsala.
| Rank | Record | Value | Player/Team | Match |
|---|---|---|---|---|
| 1 | Highest Team Total | 477 | India vs England | 2024 |
| 2 | Highest Individual Score | 111 | Steven Smith (AUS) | AUS vs IND, 2017 |
| 3 | Best Bowling Figures | 5/72 | Kuldeep Yadav (IND) | IND vs ENG, 2024 |
| 4 | Lowest Team Total | 137 | Australia | AUS vs IND, 2017 |
| 5 | Ashwin’s 100th Test | Milestone | Ravichandran Ashwin | IND vs ENG, 2024 |
Record Analysis:
- India’s 477 (Rank 1): Posted against England in 2024. India batted second and dominated. Multiple batters contributed. This total showcased Dharamsala’s batting-friendly nature even in Tests.
- Steven Smith’s 111 (Rank 2): Only Test century at this venue so far. Smith’s fighting knock came in Australia’s loss in 2017. He battled India’s spin attack brilliantly on turning pitch.
- Kuldeep Yadav’s 5/72 (Rank 3): Best Test bowling performance at Dharamsala. Kuldeep’s wrist spin dismantled England’s batting in 2024. He exploited the pitch’s turn perfectly.
- Australia’s 137 (Rank 4): Lowest Test total here. Australia collapsed in the first innings of the 2017 Test. India’s spinners, particularly Ravindra Jadeja and Ravichandran Ashwin, dominated.
- Ashwin’s 100th Test (Rank 5): Historic personal milestone in the 2024 England Test. Ashwin became only the 14th cricketer to play 100 Tests. India won convincingly.
Key Stat: Average first innings score in Tests is 259. Both Tests were won by teams batting second. No team has successfully defended a total here in Tests yet.
Dharamshala Stadium in which state? The stadium is located in Dharamsala, Himachal Pradesh, in northern India’s Himalayan region.
ODI Records (Ranked Top 6)
Complete ODI records breakdown from nine matches played at HPCA Stadium.
| Rank | Record | Value | Player/Team | Year |
|---|---|---|---|---|
| 1 | Highest Team Total | 388 | Australia vs New Zealand | 2023 World Cup |
| 2 | Highest Individual Score | 140 | Dawid Malan (ENG vs BAN) | 2023 World Cup |
| 3 | Best Bowling Figures | 5/54 | Mohammed Shami (IND vs NZ) | Recent |
| 4 | First 300+ Total | 330/6 | India vs West Indies | 2014 |
| 5 | Lowest Team Total | 112 | India vs Sri Lanka | Past series |
| 6 | Average First Innings | 253 | Across 9 ODIs | 2013-2023 |
Record Breakdown:
- Australia’s 388 (Rank 1): Posted against New Zealand during the 2023 ODI World Cup. This remains the highest team total at Dharamsala across all formats. Multiple Australian batters scored fifties in explosive innings.
- Dawid Malan’s 140 (Rank 2): Highest individual ODI score at this venue. Malan’s innings came during the England vs Bangladesh World Cup match in 2023. He dominated Bangladesh’s bowling with elegant strokeplay.
- Mohammed Shami’s 5/54 (Rank 3): Best ODI bowling performance here. Shami utilized the pitch’s extra bounce perfectly. He dismantled New Zealand’s batting lineup with pace and accuracy.
- India’s 330/6 (Rank 4): First team to cross 300 at Dharamsala in ODIs. Came against the West Indies in 2014. This established venue’s reputation as batting-friendly.
- India’s 112 (Rank 5): Lowest ODI total at the venue. India collapsed against Sri Lanka. This shows bowlers can dominate when conditions assist.
- Average 253 (Rank 6): Across 9 ODIs, the first innings average is 253. Teams posting 270+ usually win. Chasing teams have a 55% success rate (5 wins, 4 losses).
HPCA Stadium Dharamsala records in Test ODI and T20I score show ODIs produce the highest totals on average compared to other formats at this venue.
Chase Success: Teams batting second won 5 of 9 ODIs. The dew factor in evening matches helps batting. Spinners lose grip. The ball comes onto the bat nicely under the lights.
T20I Records (Ranked Top 6)
Complete T20I statistics from 10 matches (8 completed, 2 no results).
| Rank | Record | Value | Player/Team | Year |
|---|---|---|---|---|
| 1 | First & Only T20I Century | 106 | Rohit Sharma (IND vs SA) | 2015 |
| 2 | Highest Team Total & Chase | 200/3 | South Africa vs India | 2015 |
| 3 | Best Bowling Figures | 4/11 | Paul van Meekeren (NED vs IRE) | Recent |
| 4 | Average First Innings | 145 | Across 8 completed T20Is | 2015-2025 |
| 5 | Lowest Team Total | 134/9 | Australia vs New Zealand | Recent |
| 6 | Chase Success Rate | 50% | 4 wins batting second | Equal split |
Record Analysis:
- Rohit Sharma’s 106 (Rank 1): Historic innings in 2015. First T20I century at Dharamsala. Rohit smashed South African bowling all around the ground. Despite his heroics, South Africa chased down the target.
- South Africa’s 200/3 Chase (Rank 2): Highest T20I total and highest successful chase at this venue. SA chased India’s 199 with 2 balls to spare in 2015. JP Duminy and Quinton de Kock starred in a thrilling run chase.
- Van Meekeren’s 4/11 (Rank 3): Best T20I bowling figures. Netherlands pacer Paul van Meekeren destroyed Ireland. His spell showed that even associate nation bowlers can exploit Dharamsala’s bounce.
- Average 145 (Rank 4): First innings average in T20Is is 145. Teams posting 160+ have a strong chance of winning. But even 200 was chased successfully, showing batting-friendly conditions.
- Australia’s 134/9 (Rank 5): Lowest T20I total here. Australia struggled against New Zealand. Shows that despite a batting-friendly reputation, bowlers can dominate with right execution.
- 50% Chase Rate (Rank 6): Perfect balance – 4 wins batting first, 4 wins batting second. Toss doesn’t guarantee an advantage. Quality execution matters more than batting order.
Dharamshala stadium T20 records ipl scorecard database shows similar high-scoring patterns when Punjab Kings play home matches at this venue.
Highest run chase in Dharamsala in IPL: While the exact IPL chase record isn’t specified in the source, the international T20I record of 200/3 chase by South Africa sets the benchmark for T20 cricket at this ground.
Best XI at HPCA (Ranked Positions 1-11)
Here’s the dream team of players who made landmark contributions at Dharamsala.
- 1. Rohit Sharma (Opener) – India
Scored the venue’s only T20I century (106 vs SA, 2015). Explosive opener who dominated at Dharamsala.
- 2. Quinton de Kock (Opener/WK) – South Africa
Starred in a record 200-run chase in T20I. An explosive opener who loves batting at this venue.
- 3. Steven Smith (No. 3) – Australia
Only Test centurion at Dharamsala (111 vs India, 2017). Battled spin brilliantly on a difficult pitch.
- 4. Dawid Malan (No. 4) – England
Highest ODI score at the venue (140 vs Bangladesh, 2023). Elegant stroke player who mastered conditions.
- 5. Virat Kohli (No. 5) – India
Multiple contributions at Dharamsala across formats. India is chase master in limited overs.
- 6. JP Duminy (No. 6) – South Africa
Key player in SA’s record T20I chase. Finished the game brilliantly under pressure.
- 7. Ravichandran Ashwin (All-Rounder) – India
Played 100th Test here. Multiple wickets across formats. Understands the Dharamsala conditions perfectly.
- 8. Ravindra Jadeja (All-Rounder) – India
Dominated with the ball in the Australia Test (2017). Left-arm spin and batting depth are crucial.
- 9. Kuldeep Yadav (Bowler) – India
Best Test bowling figures (5/72 vs England, 2024). Wrist spinner who exploited the pitch’s turn.
- 10. Mohammed Shami (Bowler) – India
Best ODI bowling (5/54 vs NZ). Utilized extra bounce perfectly with pace and accuracy.
- 11. Paul van Meekeren (Bowler) – Netherlands
Best T20I figures (4/11 vs Ireland). Proved associate bowlers can dominate here too.
Team Balance: Three spinners (Ashwin, Jadeja, Kuldeep) exploit turn. Two quality pacers (Shami, van Meekeren) use bounce. The top order is loaded with stroke-makers. The middle order has experience.
Dharamshala stadium all match scorecard across these 21 international matches confirms these players made the biggest impacts.
Quick Stat Box
- Average Chase Success Across Formats:
Tests: 100% (2/2 wins batting second). ODIs: 55% (5/9 wins chasing). T20Is: 50% (4/8 wins batting second). Overall, chasing has a 57% success rate at Dharamsala. Knowing the target helps batters plan innings better.
- Dew Factor Impact:
Evening matches see significant dew after 8:00 PM. Spinners struggle to grip the ball in the second innings. Fast bowlers also can’t control swing. This explains why chasing is easier. Teams bowling second leak 8-10% more runs in death overs.
- Boundary Sizes Matter:
Square boundaries are approximately 65 meters. Straight boundaries stretch to 75+ meters. Large dimensions mean mishits get caught easily. Only quality shots clear ropes. This rewards timing over power hitting.
HPCA Stadium Dharamsala records in test, ODI, and T20I today continue evolving as India schedules more international matches at this picturesque Himalayan venue.
Conclusion
HPCA Stadium Dharamsala Records in Test, ODI, and T20I reveal Tests favor teams batting second (2-0 record), ODIs slightly favor chasing (55% success), and T20Is are perfectly balanced (50-50), with the venue’s high altitude, extra bounce, and evening dew creating unique tactical challenges across all three formats.
Also Check:
- Maharaja Yadavindra Singh International Cricket Stadium
- Barabati Stadium
- Most Beautiful Cricket Stadium In The World
References:
Blackjack rules chart graysonbotc184630.diowebhost.com
References:
Parks casino web.symbol.rs
References:
Prairie meadows casino https://vulkan-casino-no-deposit-bonus.online-spielhallen.de
References:
Euroking casino atpo.ca